COMING UP soon | on SEPTEMBER 9th, 2025
MPM-School leaders gathering 2025


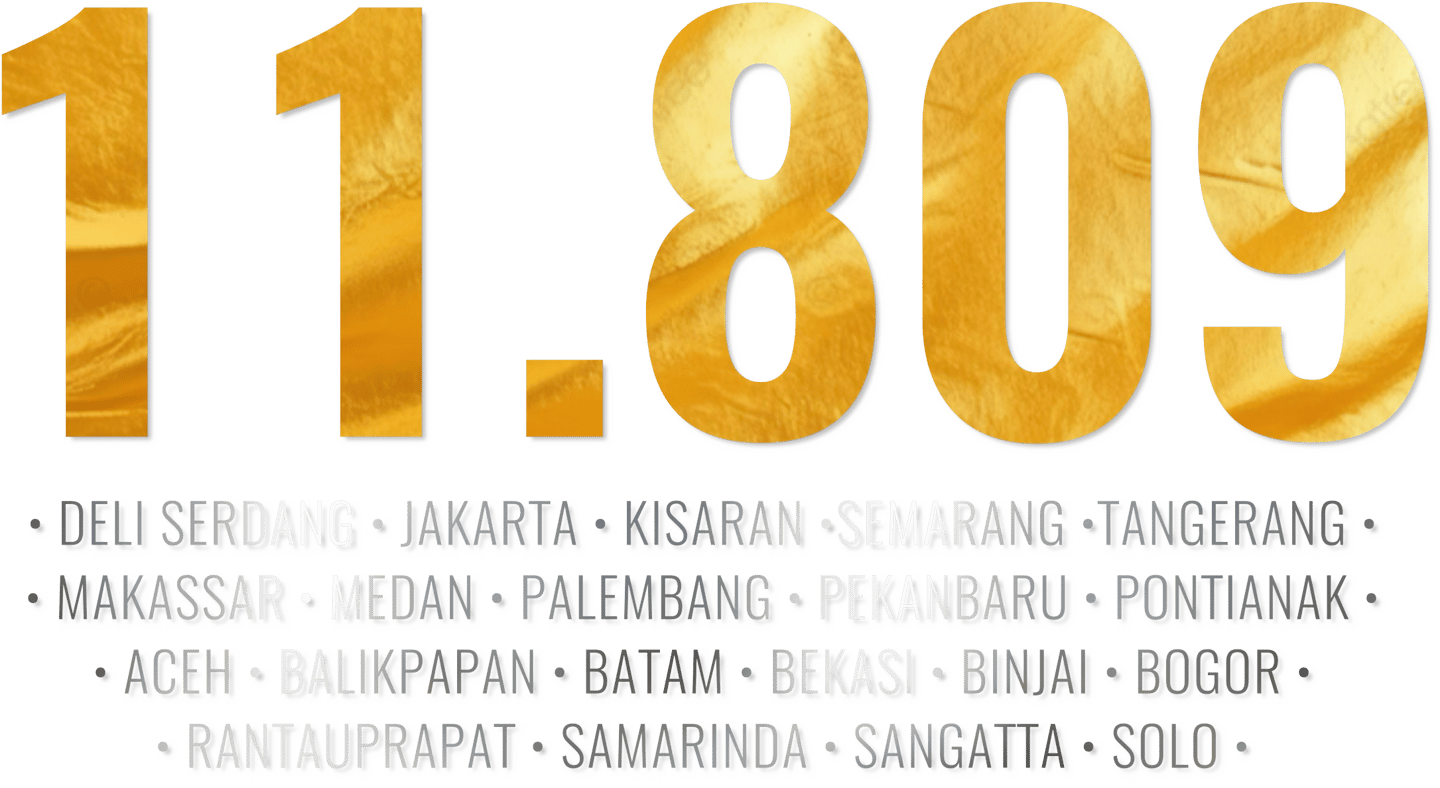
On 9 August 2025, MPM conducted a synchronized four-skills English assessment
(Listening; Speaking; Reading; Writing) with 11,809 students.

Regional Distribution of Student Participants by Education Level
This dashboard visually presents the geographic breakdown of student participants across multiple cities in Indonesia.
The data covers total counts and percentages for each city, further segmented by education levels
SD (Elementary), SMP (Middle School), SMA (High School), and SMK (Vocational School).
Analytics & Insights
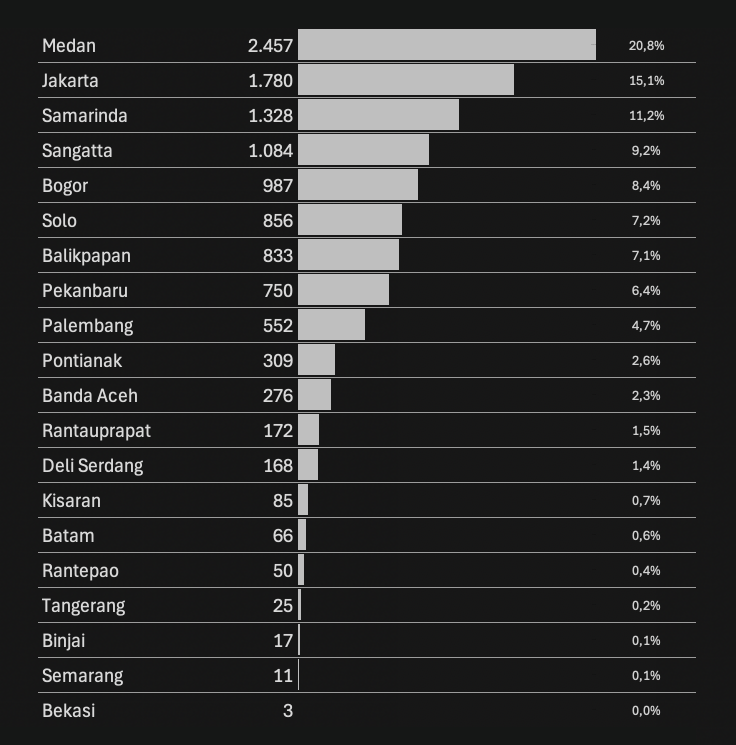
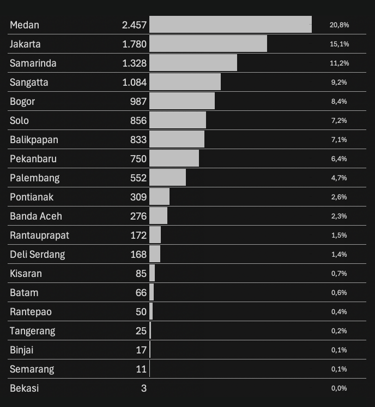
The assessment reached the largest audience among high schools and junior high schools, indicating stronger engagement or outreach at those levels. Medan leads with the highest number of participants (2,457 total, 20,8%), followed by Jakarta (1,780, 15,1%) and Samarinda (1,328, 11,2%). These three cities account for half of all participants.
Total Contribution by School Unit
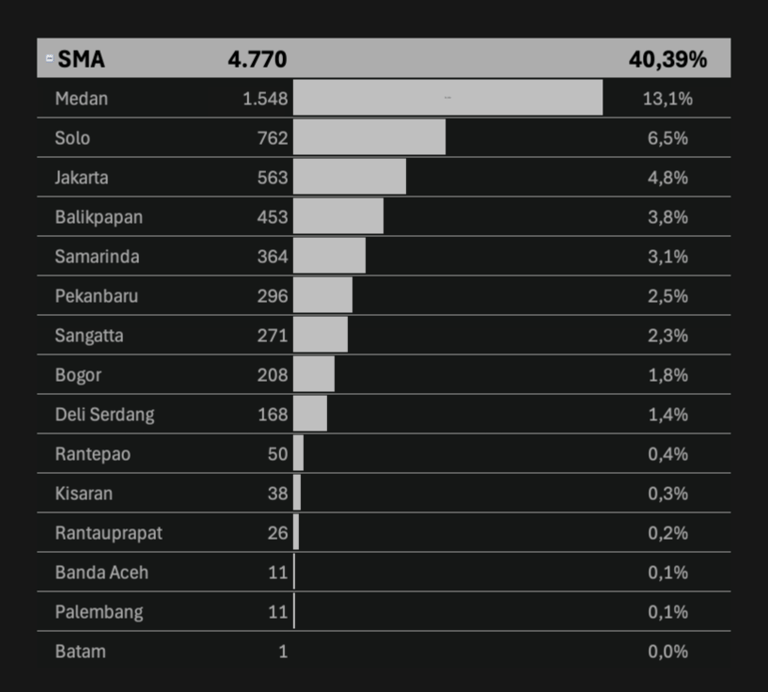
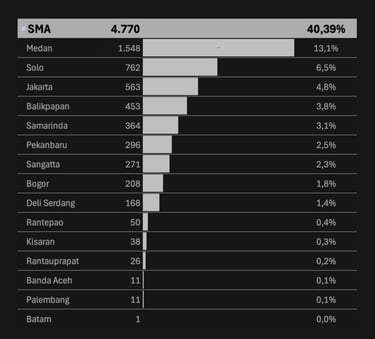
• SMA (Senior High School): 4,770 students (40.39%)
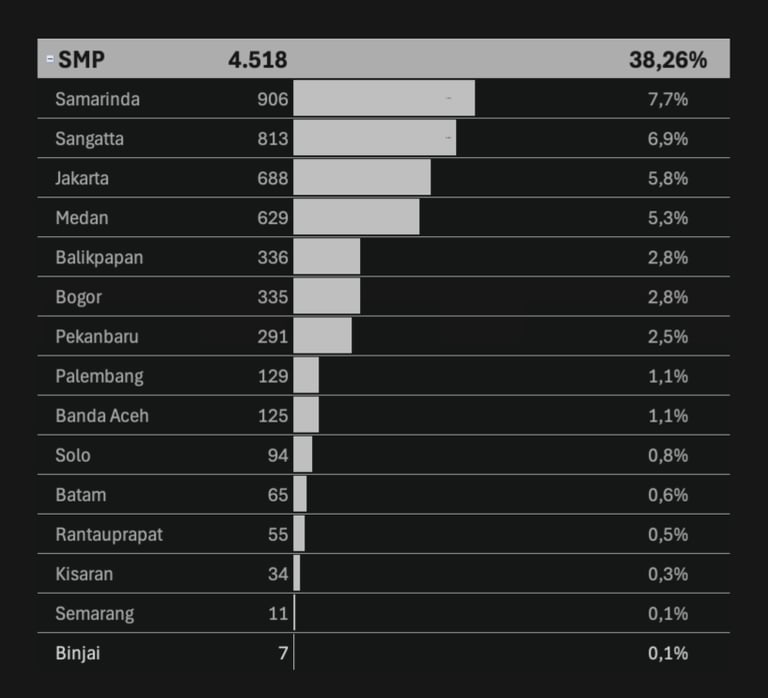
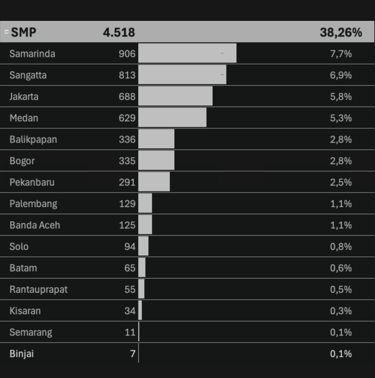
• SMP (Junior High School): 4,518 students (38.26%)
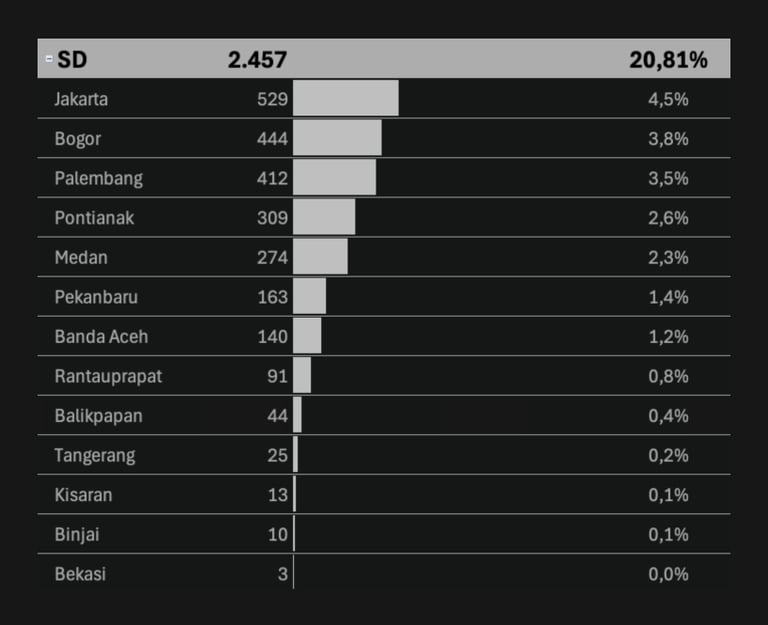
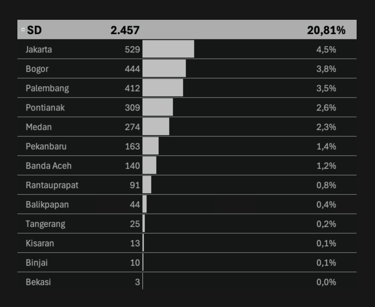
• SD (Elementary School): 2,457 students (20.81%)
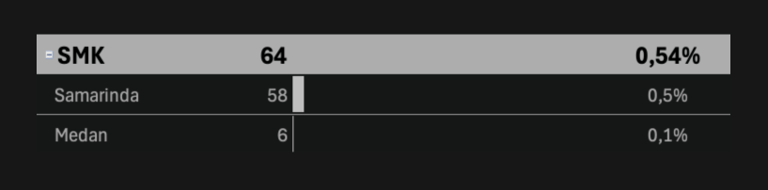
• SMK (Vocational School): 64 students (0.54%)
Top 3 Regions for Each Unit
SD (Elementary School)
1. Jakarta: 529 students (21.5% of SD total)
2. Bogor: 444 students (18.1% of SD total)
3. Palembang: 412 students (16.8% of SD total)
SMP (Junior High School)
1. Samarinda: 906 students (20% of SMP total)
2. Sangatta: 813 students (18% of SMP total)
3. Jakarta: 688 students (15.2% of SMP total)
SMA (Senior High School)
1. Medan: 1,548 students (32.4% of SMA total)
2. Solo: 762 students (16% of SMA total)
3. Jakarta: 563 students (11.8% of SMA total)
SMK (Vocational School)
1. Samarinda: 58 students (90.6% of SMK total)
2. Medan: 6 students (9.4% of SMK total)
3. – (No other region has significant participation in SMK.
These three regions contribute over half of all elementary school participants, indicating strong SD-level program presence in urban centers.
Samarinda and Sangatta stand out for SMP, with Jakarta maintaining a strong showing, reflecting active programs in those cities.
Medan is a clear leader in the SMA category, followed by Solo and Jakarta. Medan alone contributes nearly a third of all SMA participants.
SMK participation is extremely concentrated; almost all comes from Samarinda, with minimal involvement elsewhere. This reveals a considerable outreach gap at the vocational level.
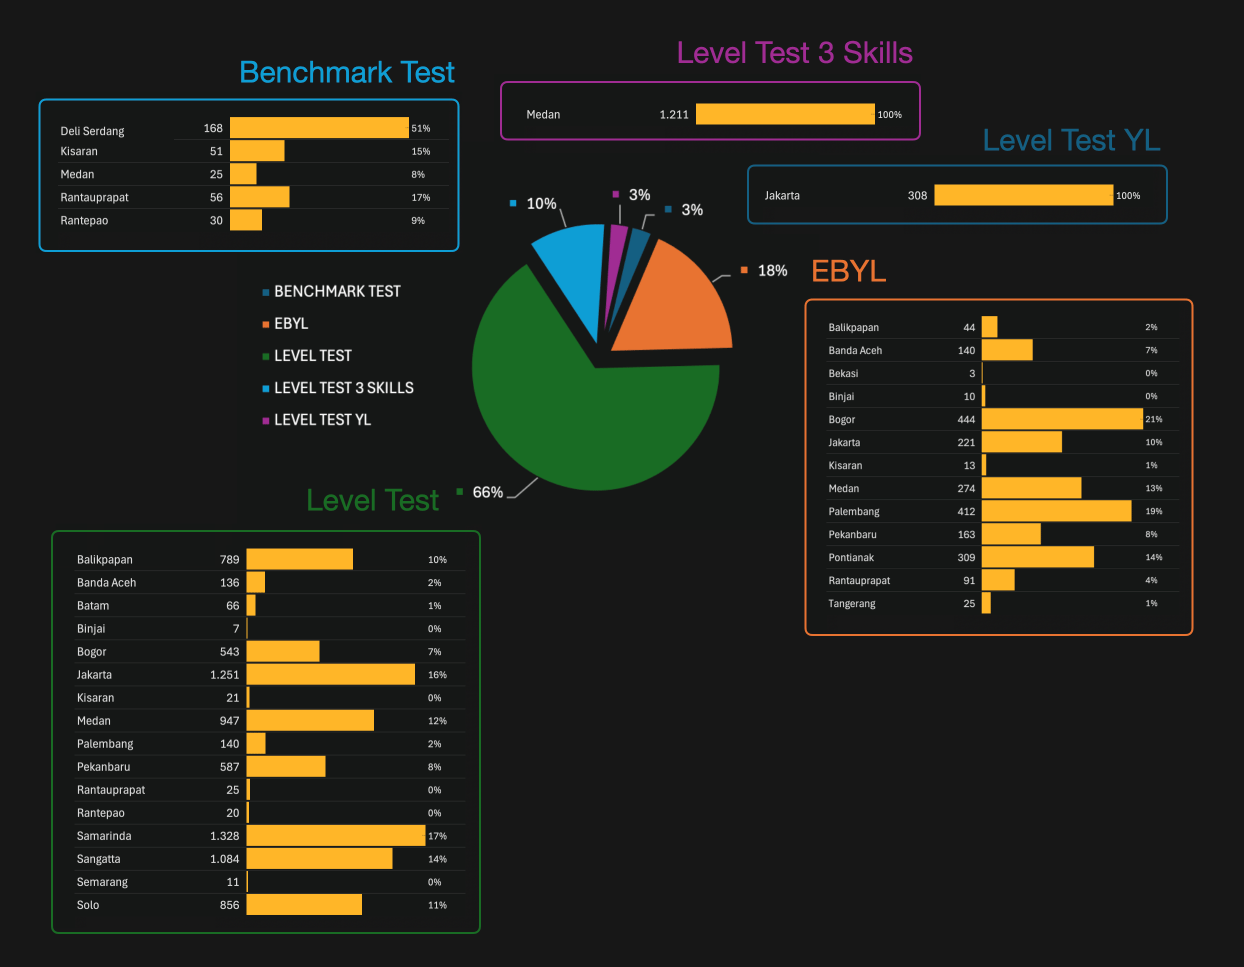
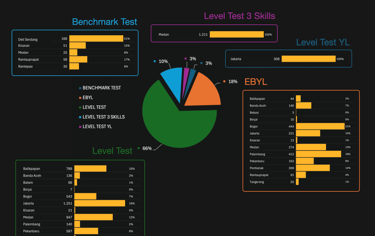
Test Taker Distribution by Test Type
the number of test takers distributed across five different English assessment types:
Analytics & Insights
Level Test (SMP and SMA) dominates, representing nearly two-thirds of total test takers, signaling it as the main assessment tool used.
This implies strong demand for general proficiency mapping and placement services.
EBYL (Early Beginners Young Learners) forms the second-largest group, highlighting a significant focus on young learner assessment programs.
Benchmark Test and specialized Level Tests (3 Skills, for Young Learners) represent niche yet targeted testing, usually region- or city-concentrated (e.g., all Level Test 3 Skills in Medan, Level Test for Young Learners in Jakarta).
Participation is unevenly distributed across regions—some cities (e.g., Jakarta, Samarinda, Palembang) serve as key hubs for specific assessment types, suggesting localized needs/engagement with particular test products.
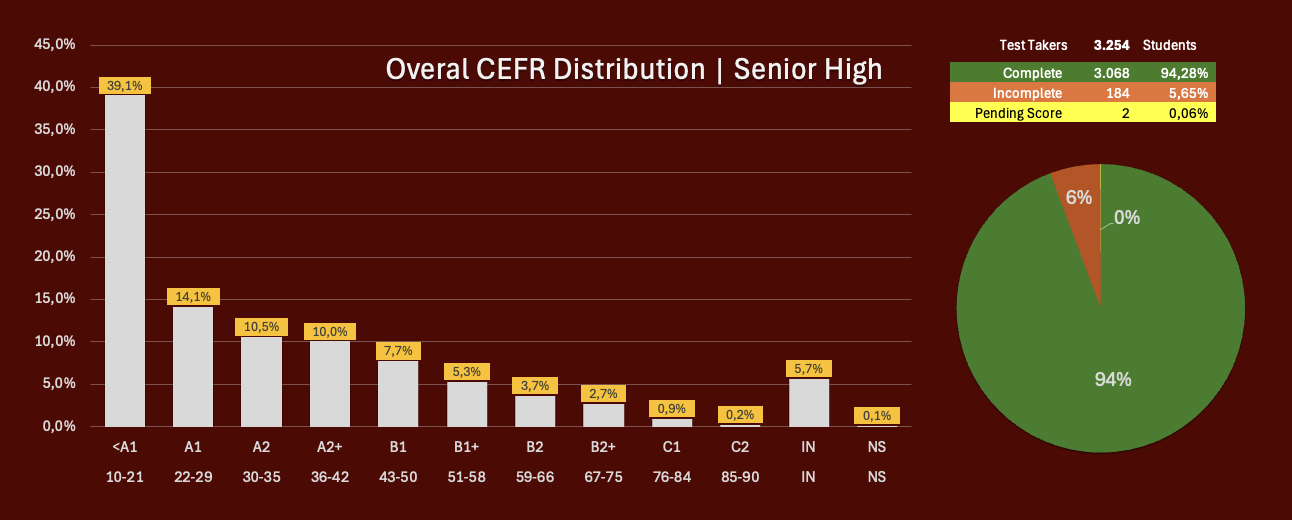
CEFR & GSE Range Distribution of Junior High and Senior High School Students in Level Test
Insights & Differences Between SMP and SMA
Proficiency Advancement: Senior High students show a moderate improvement, with fewer at <A1 (39.1%) compared to Junior High (44.1%), and slightly more in A1, A2, and above.
Majority Below International Threshold: Both groups are predominantly at <A1 and A1, signaling significant room for improvement to reach B1 or higher, widely recognized for functional English proficiency.
B1+ and Above is Scarce: Less than 10% of both groups achieve B1 or higher levels, underscoring challenges in progression past basic English competence.
Incomplete Scores: Slightly higher rate of incompletion in SMA (5.65%) compared to SMP (4.13%), but both are low.
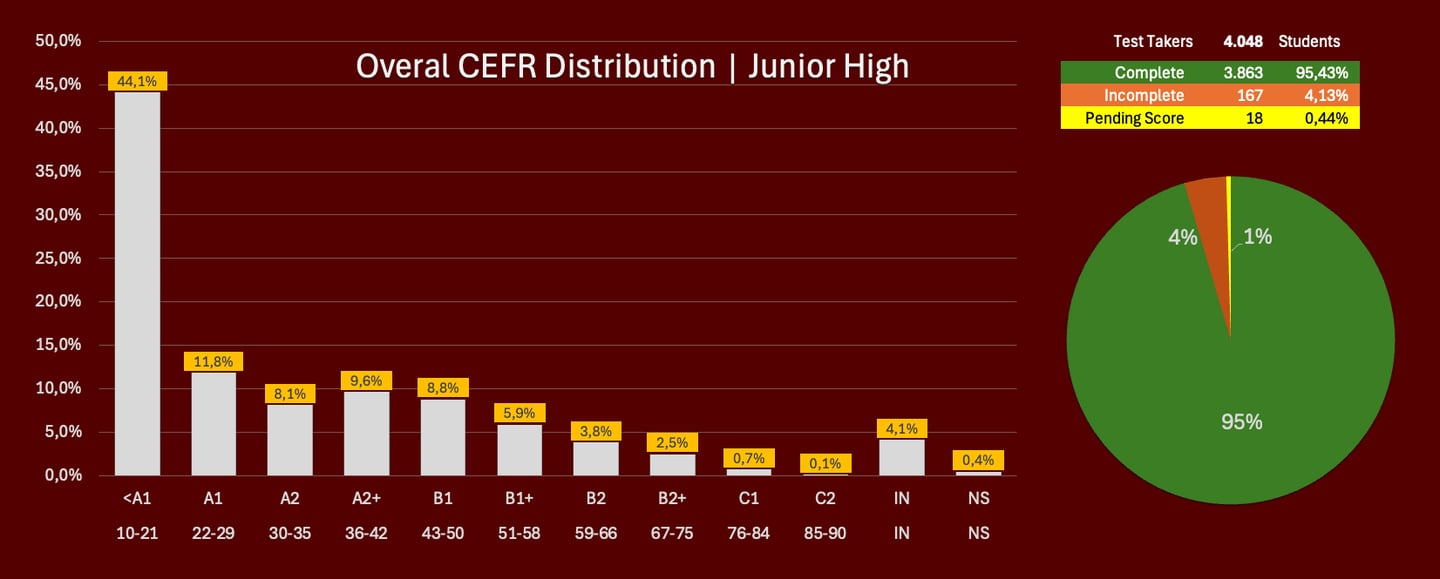
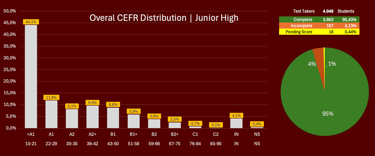


Junior High (SMP) CEFR Distribution: Low Proficiency Dominates: Nearly half are below A1, indicating the majority operate in the lowest proficiency band.
Senior High (SMA) CEFR Distribution: Slightly More Students in Higher Bands Compared to SMP, but still a large majority remain in A2 level or below.
Level Test 3 Skills CEFR & GSE Distribution (Excluding Speaking)
Insights & Differences Between SMP and SMA
More Even Distribution: The performance is better balanced across CEFR bands (A1 to B2+) compared to the 4-skills test (which includes Speaking), where typically most students concentrate in the lowest bands.
Fewer at the Lowest Level: Only 14.9% are at <A1, compared to 39%–44% in the full 4-skills tests—indicating fewer students are stuck in the lowest proficiency bands.
Higher Bands More Populated: Noticeably more students reach A2+, B1, and even B2 and above, with 9.2% at B1+ and 4.5% at B2. The 4-skills distribution had less than 3% reach B2 or above.
Incomplete Scores: Slightly higher rate of incompletion in SMA (5.65%) compared to SMP (4.13%), but both are low.
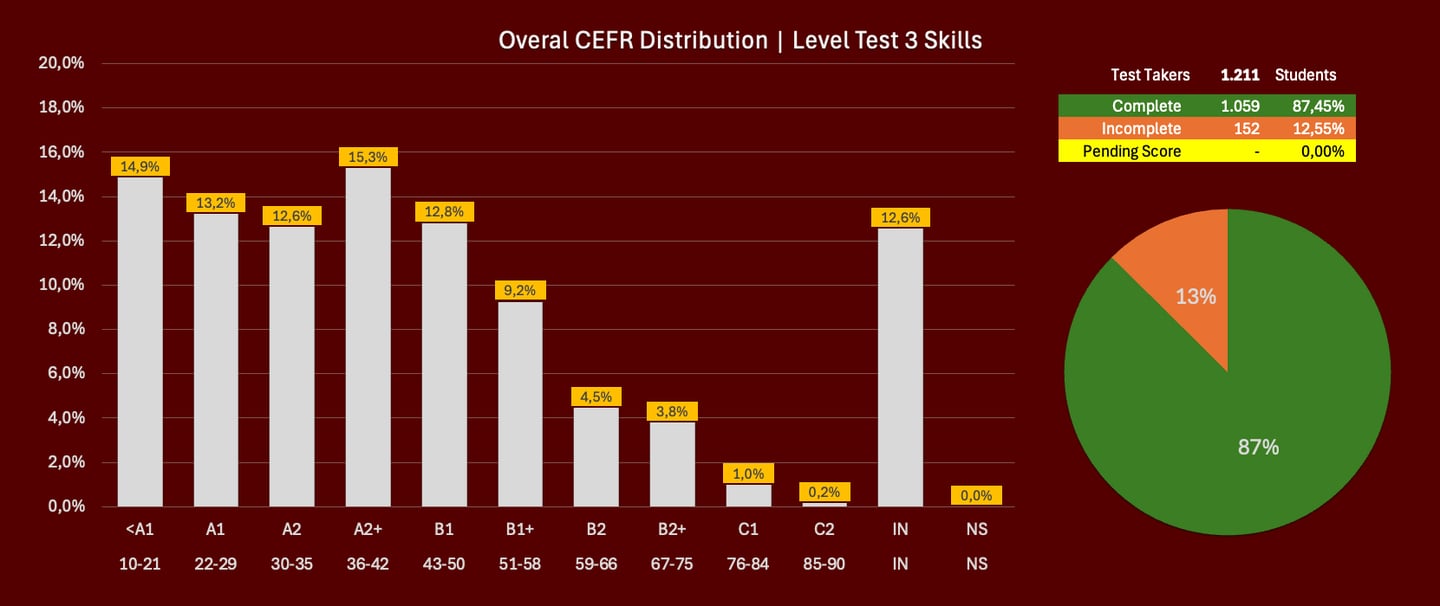


Absence of Speaking Lowers Difficulty:
Speaking is often the most challenging skill for students in non-English-speaking environments due to limited practice opportunities. Removing speaking means students’ productive competence is not limiting their overall score.
Receptive Skills Drive Scores Up:
Reading and Listening are typically acquired earlier and more readily with exposure to classroom and passive English materials. Writing, while still productive, is generally easier for test-takers when compared to spontaneous speaking.
Reflects Classroom Emphasis:
Indonesian students’ classroom activities often focus on Reading and Listening, offering higher familiarity and preparedness for these skills than for Speaking.
Less Anxiety, More Demonstration:
Excluding Speaking reduces test anxiety and allows students to perform closer to their receptive and written language potentials, revealing a truer measure of their “academic” English proficiency.
Why Is the 3 Skills Distribution Better Than Level Test 4 Skills
Suggestion
Level Test 3 Skills results show a more optimistic distribution with more students achieving higher CEFR bands, highlighting disparities in skill development—especially the continuing challenge of advancing oral proficiency compared to receptive and written skills.
For improvement: Focused support in Speaking is crucial for lifting overall English proficiency to match gains seen in other areas.
Platform ini sangat membantu saya memahami perkembangan kemampuan bahasa Inggris saya dengan jelas dan terperinci.
★★★★★


Benchmark Test
Insights & Differences Between SMP and SMA
More Even Distribution: The performance is better balanced across CEFR bands (A1 to B2+) compared to the 4-skills test (which includes Speaking), where typically most students concentrate in the lowest bands.
Fewer at the Lowest Level: Only 14.9% are at <A1, compared to 39%–44% in the full 4-skills tests—indicating fewer students are stuck in the lowest proficiency bands.
Higher Bands More Populated: Noticeably more students reach A2+, B1, and even B2 and above, with 9.2% at B1+ and 4.5% at B2. The 4-skills distribution had less than 3% reach B2 or above.
Incomplete Scores: Slightly higher rate of incompletion in SMA (5.65%) compared to SMP (4.13%), but both are low.
Why Is the 3 Skills Distribution Better Than Level Test 4 Skills
Suggestion
Level Test 3 Skills results show a more optimistic distribution with more students achieving higher CEFR bands, highlighting disparities in skill development—especially the continuing challenge of advancing oral proficiency compared to receptive and written skills.
For improvement: Focused support in Speaking is crucial for lifting overall English proficiency to match gains seen in other areas.
EBYL
Insights & Differences Between SMP and SMA
More Even Distribution: The performance is better balanced across CEFR bands (A1 to B2+) compared to the 4-skills test (which includes Speaking), where typically most students concentrate in the lowest bands.
Fewer at the Lowest Level: Only 14.9% are at <A1, compared to 39%–44% in the full 4-skills tests—indicating fewer students are stuck in the lowest proficiency bands.
Higher Bands More Populated: Noticeably more students reach A2+, B1, and even B2 and above, with 9.2% at B1+ and 4.5% at B2. The 4-skills distribution had less than 3% reach B2 or above.
Incomplete Scores: Slightly higher rate of incompletion in SMA (5.65%) compared to SMP (4.13%), but both are low.
Why Is the 3 Skills Distribution Better Than Level Test 4 Skills
Suggestion
Level Test 3 Skills results show a more optimistic distribution with more students achieving higher CEFR bands, highlighting disparities in skill development—especially the continuing challenge of advancing oral proficiency compared to receptive and written skills.
For improvement: Focused support in Speaking is crucial for lifting overall English proficiency to match gains seen in other areas.
Level Test Young Learners
Insights & Differences Between SMP and SMA
More Even Distribution: The performance is better balanced across CEFR bands (A1 to B2+) compared to the 4-skills test (which includes Speaking), where typically most students concentrate in the lowest bands.
Fewer at the Lowest Level: Only 14.9% are at <A1, compared to 39%–44% in the full 4-skills tests—indicating fewer students are stuck in the lowest proficiency bands.
Higher Bands More Populated: Noticeably more students reach A2+, B1, and even B2 and above, with 9.2% at B1+ and 4.5% at B2. The 4-skills distribution had less than 3% reach B2 or above.
Incomplete Scores: Slightly higher rate of incompletion in SMA (5.65%) compared to SMP (4.13%), but both are low.
Why Is the 3 Skills Distribution Better Than Level Test 4 Skills
Suggestion
Level Test 3 Skills results show a more optimistic distribution with more students achieving higher CEFR bands, highlighting disparities in skill development—especially the continuing challenge of advancing oral proficiency compared to receptive and written skills.
For improvement: Focused support in Speaking is crucial for lifting overall English proficiency to match gains seen in other areas.